COVID19 TRACKER - JAPAN
automated data visualizer of current Covid19 situation by prefectures in Japan in tableau
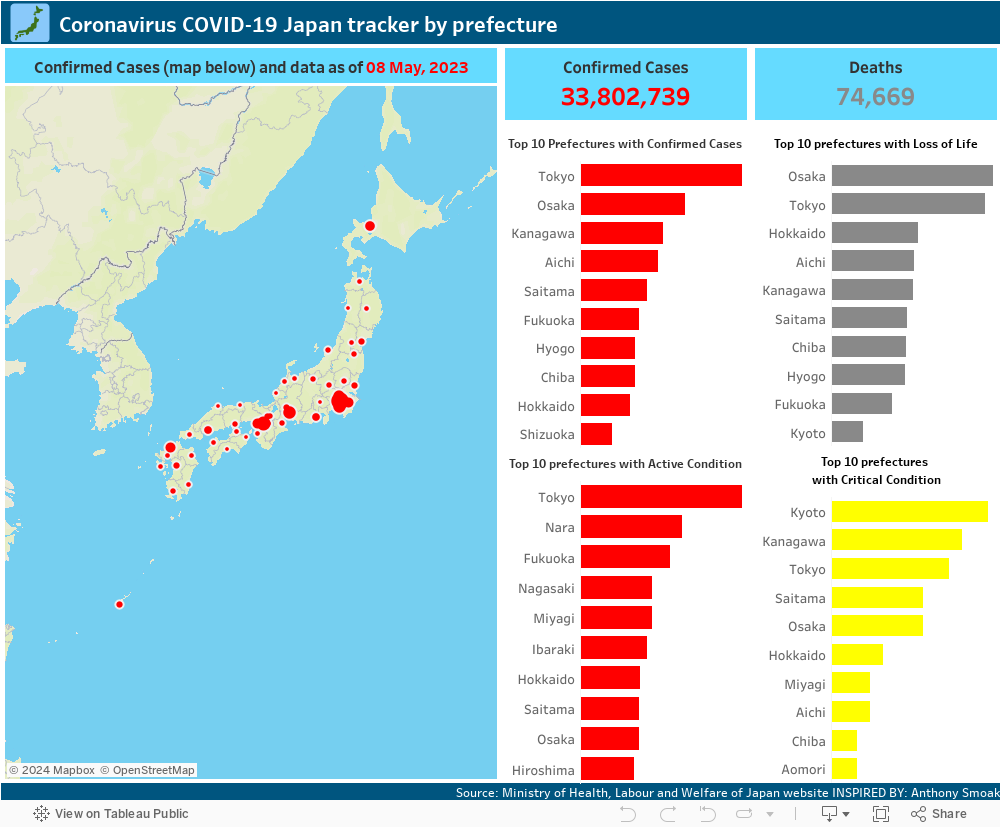
Current data visualized in tableau is as of: 08 May, 2023
The latest data available is as of: 08 May, 2023
The data in tableau is up to date with the latest source data available
ABOUT THIS WEB APPLICATION
This is a web application I built with Python that automates scraping latest covid19 data for Japan for its 47 prefecturesfrom the Japanese government website and visualize the data in tableau dashboard.
The Japanese Ministry of Health, Labour and Welfare publishes the latest informationon Coronavirus situation in Japan on almost daily basis on its websitehowever I noticed that 1) many data are not presented visually, 2) most data is only available in Japaneseand 3) data I wanted is pubilshed on the web in PDF format.
What I wanted to check on regular basis from the website was the latest data of the situationby 47 different prefectures in Japan and the data was available but in PDF table formatand I can not tell whether the data (PDF in this case) is up to date or when it was last updated unless I manualy open the PDF file from the website and check the date of update within the PDF file.
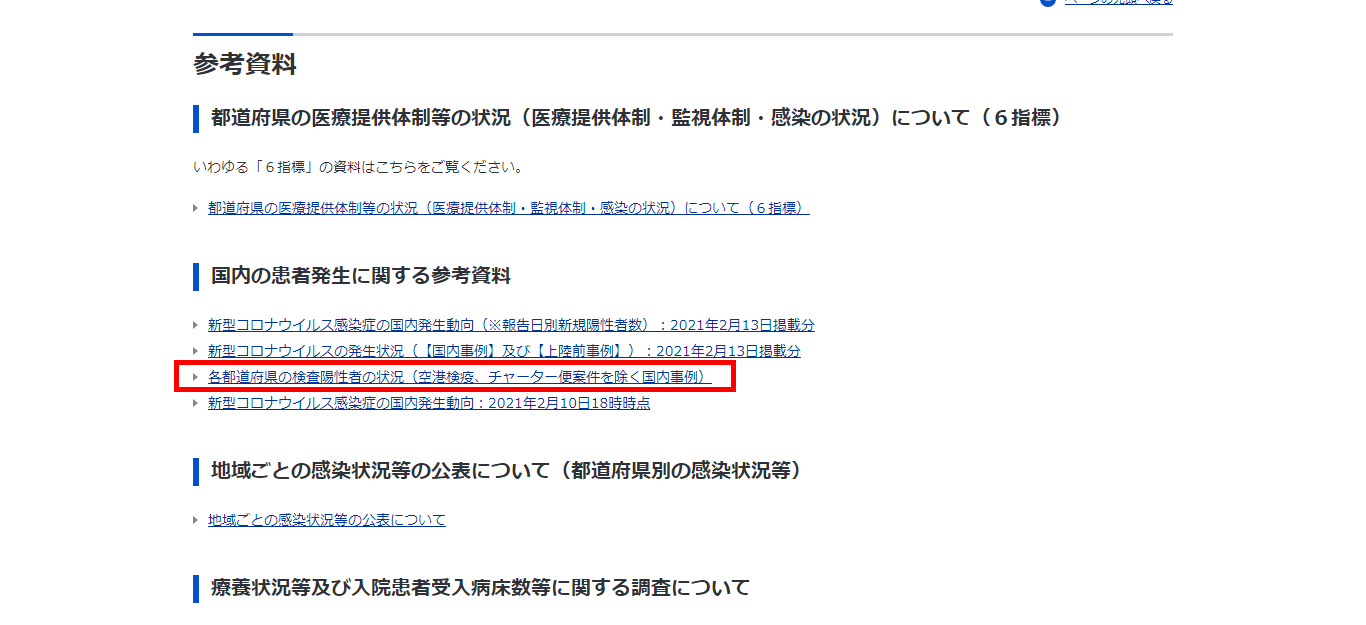
The link on the website marked in RED box for the PDF
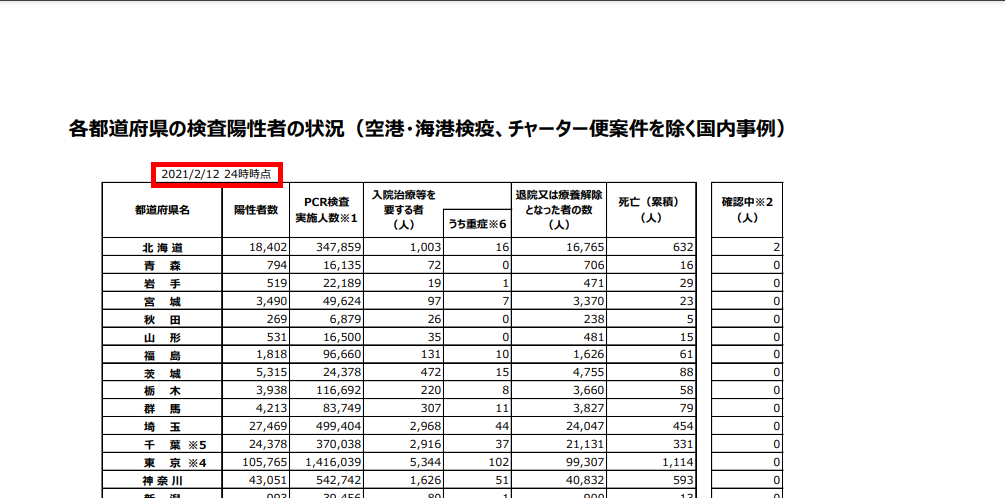
The date of update in RED box on the PDF
So without having to go and check the website, I wanted my web application to find out if the latest data is availableand if so, fetch, cleans, process the data and updates existing dataand visually presents the data using tableau dashboard with a single click on the button.
AUTOMATION
I wanted to start with automating two processes here, the first is to1) Find out if the new PDF (updated data) is availabe,and 2) ONLY if the new PDF is available, scrape the data in the new PDF and update the existing now no longer up-to-date data,without manually having to go to the website and open the PDF link.
DATA EXTRACTION and SCRAPING
Every time the data I need from the website gets updated, the new PDF file is generated so is the URL link for
the PDF file,meaning the URL link of the file is dynamic.
Therefore in order to scrape and extract the data from the PDF file,I have to search for and
extract the URL link for the PDF file from the website first.
So using BeautifulSoup library, I parse the website
where the PDF file is available via link,and within the parsed data I look for the data I need with
the headline of the datawhich is "各都道府県の検査陽性者の状況" (meaning Confirmed Cases Data by different
prefecture in Japanese) in this case, then get the URL link attribute.
Once I have the URL link of the PDF file, next step is to send a GET request to the linkand
extract the date of update (the date of the new PDF file data is as of),written on top part of the
PDF file in text using requests library and PDFplumber.
At this stage, I will not extract the rest of the data on the PDF file,the date of update text to
find out whether the new data (new PDF) is available or not.
If the date of update extracted is ahead of the date of update on hand,that means newer PDF file
is on the website with most up-to-date data in the PDF file,if not it simply means the website has
not updated the PDF file yet.
So only if the new PDF file is available, I will extract the latest data from the latest PDF file.
Unlike the date of update in text, the rest of the data in the PDF file is in table format,
so this time I use tabula to extract the table with the data from the PDF file.
DATA TRANSFORMATION and PROCESSING
After getting the data from the PDF file I process the data with pandas,
rename dataframe
columns from Japanese to English, transform the list of prefecture names in Japanese to the list of prefecture
names in English
using the JSON file (dictionary with prefecture names in English and Japanese pairs) I
prepared,
remove unwanted characters so that the data can be used in tableau later on for data visualisation
and so on.
DATA LOADING
After all the data processing the data gets loaded to google spreadsheets assigned
and replace the existing
data and this spreadsheet also works as the data source for tableau for the data visualisation.
WEB APPLICATION FRONTEND
When the latest data updates the spreadsheet it also updates the date of update in the specified cell,on the
frontend of the application I use the date in the cell as the current data date.
If the date of update of the latest PDF file on the website is ahead of the current data date,I get the
frontend to display the message and UPDATE button to update the data in the spreadsheet.
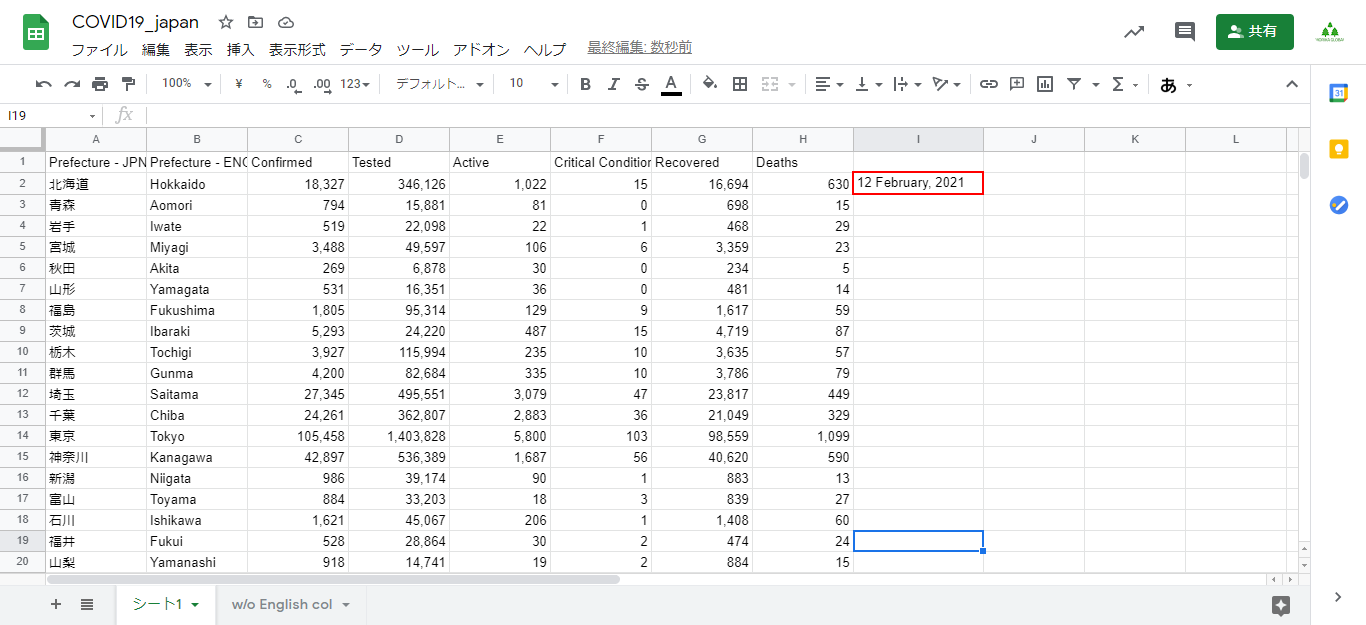
The date of updated cell in RED in Google Spreadsheets
How the frontend shows the date of update
DATA VISUALISATION
Using the google spreadsheet as the data source, tableau visualizes the data.
When the spreadsheet is updated with new data, tableau reflects the changes in the data (although it may take
some time at times).
The data that was only available in Japanese in PDF table format is now available visually in tableau dashboard
with all the process automated.